Creating pivot tables in Python
- Ekta Aggarwal

- Jan 28, 2021
- 3 min read
Pivot tables are a powerful way to get descriptive statistics like mean, median, count, standard deviation etc. specially when we need to aggregate the results for various categorical variables or groups.
In this tutorial we shall learn about them in detail using pandas' pivot_table( ) function.
Let us firstly import pandas:
import pandas as pdSyntax
data.pivot_table(values = "list of column names for aggregation ",
index = "List of categorical column for rows",
columns="List of categorical column for column",
aggfunc = [List of functions to be evaluated],
margins = [True or False for getting grand total i.e. margin],
margins_name="Column name for Grand Total or Margins")
Dataset:
In this tutorial we will make use of following CSV file:
Let us read our file using pandas' read_csv function. Do specify the file path where your file is located:
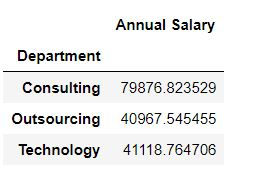
mydata = pd.read_csv("C:\\Users\\Desktop\Employee_info.csv")Task 1: Get average salary for each department.
mydata.pivot_table(values = "Annual Salary ",index = "Department")By default Python calculates averages for numeric columns. Thus to get an average salary we have defined values = "Annual Salary "
We want to show the data for each department in rows : thus we defined index = "Department"
Task 2: Get median salary for each department.
To get median salary we have define aggfunc = np.median in the code below.
import numpy as np
mydata.pivot_table(values = "Annual Salary ",index = "Department",aggfunc = np.median)
Task 3: Get average and median salary for each department.
To calculate multiple statistics we have defined the list of functions [np.median , np.mean] in aggfunc
mydata.pivot_table(values = "Annual Salary ",index = "Department",aggfunc = [np.median,np.mean])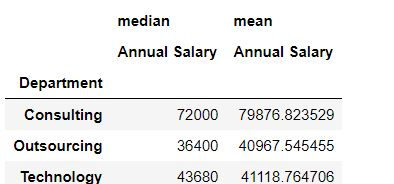
Task 4: Get average and median salary for each department and gender.
To create a 2X2 view of department and age we have defined columns = "Gender".
Note: If we wanted we could have specified index = ["Department" ,"Gender"] but that would have resulted in a long table instead of a 2X2 table.
mydata.pivot_table(values = "Annual Salary ",index = "Department",columns="Gender",aggfunc = [np.median,np.mean])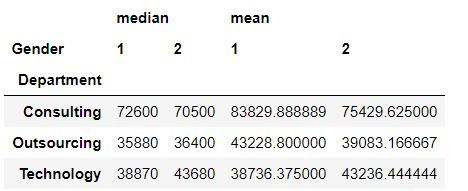
Task 5: Get average and median salary for each department and gender and fill the missing values by 0.
In our case we have no missing values, but suppose if in the data we had no entry corresponding to Consulting Department and Gender = 1 then in the pivot table we would have got NaN (missing values). We can fill these missing values using fill_value in pivot_table. Here I am filling my missing values by 0
mydata.pivot_table(values = "Annual Salary ",index = "Department",columns="Gender",aggfunc = [np.median,np.mean],fill_value=0)Getting the grand totals
Task 6: Get average and median salary for each department and gender and get the row totals
By specifying margins = True we can see the grand mean and grand median for each department and gender. By default margins = False
mydata.pivot_table(values = "Annual Salary ",index = "Department",columns="Gender",\
                   aggfunc = [np.median,np.mean],fill_value=0,margins = True)
Task 7: Rename the "All" column for margins.
By specifying margins = True and margins_name = "Overall" we can rename the All column for margins.
mydata.pivot_table(values = "Annual Salary ",index = "Department",columns="Gender",\
                   aggfunc = [np.median,np.mean],margins_name="Grand total",margins = True)
Saving the pivot table and doing computations
Task 8: Save the pivot table.
mypivot = mydata.pivot_table(values = "Annual Salary ",index = "Department",columns="Gender")

print(mypivot)
Task 9: Retrieve the average salary for consulting department from mypivot.
Since department names are in rows thus filtering the rows by "Consulting" we can get data for this department.
mypivot.loc["Consulting",:]
Task 10: Retrieve the average salary for both the genders from mypivot.
We can use .mean( ) function. Since we want the calculate the mean for all the rows in a gender thus we need to specify axis = "index" or axis = 0
mypivot.mean(axis = "index")
Task 11: Retrieve the average salary for each department from mypivot.
Since we want the calculate the mean for all the columns belonging to a particular department thus we need to specify axis = "columns" or axis = 1
mypivot.mean(axis = "columns")


Comments