PROC MEANS is one of the most powerful procedures in SAS which is used to calculate various summary statistics like mean, median, count, count of missing values, standard deviation, range, percentiles and many more for NUMERIC columns in our data.
In this tutorial we shall make use of inbuilt SAS dataset SASHELP.SHOES
Basic Syntax:
Using DATA = specify the dataset on which you want to run
roc means.
PROC MEANS DATA = SASHELP.SHOES;
RUN;
Default Output:
By default PROC MEANS provides 5 basic statistics: Number of non-missing observations, Mean, standard deviation, minimum and maximum for all the numeric columns

Specifying the decimal places in output
We can also specify the number of decimals places using MAXDEC.
For instance, I want 2 decimal places in my output.
PROC MEANS DATA = SASHELP.SHOES maxdec = 2;
RUN;
Filtering the data in PROC means
We can also filter the dataset first and then apply PROC MEANS by specifying WHERE CONDITION at data step or in the next statement.
For instance, let us calculate summary statistics only for those rows where Sales is more than $40,000.
PROC MEANS DATA = SASHELP.SHOES (WHERE = (SALES > 40000));
RUN;
Alternatively
PROC MEANS DATA = SASHELP.SHOES;
WHERE SALES > 40000;
RUN;
Running proc means only on some of the numeric variables
By default PROC MEANS calculates summary statistics on all of the numeric columns, but what if you need to run PROC MEANS only on some of the column. We can define the relevant variable list using VAR statement.
For instance, we are running PROC MEANS only on the variables SALES and RETURNS.
PROC MEANS DATA = SASHELP.SHOES;
VAR SALES RETURNS;
RUN;
Grouping by categorical variables
Many a times we need to calculate the statistics for each group in a categorical variable. For such cases we use CLASS statement in PROC MEANS.
For instance, we are running PROC MEANS for all the variables and the output will be divided for various Regions.
PROC MEANS DATA = SASHELP.SHOES;
CLASS REGION;
RUN;
In the output N Obs denotes the number of observations corresponding to each region. The entire table is sorted on the basis of N Obs.

Sorting the regions by descending order
To sort the regions by descending order we write / DESCENDING.
PROC MEANS DATA = SASHELP.SHOES;
CLASS REGION / DESCENDING;
RUN;
Grouping by multiple class variable
We can define multiple categorical variables in class statement.
PROC MEANS DATA = SASHELP.SHOES;
CLASS REGION PRODUCT / DESCENDING;
RUN;
Arranging the data by frequency in ascending order
To sort the regions on the basis of ascending order of number of observations we define ORDER = freq ASCENDING in class statement.
PROC MEANS DATA = SASHELP.SHOES;
CLASS REGION / ORDER = freq ascending;
RUN;
Selecting only some of the statistics
We may not need all the default statistics which PROC MEANS offer. To modify the statistics which we want in our output we define our list in data step.
In the following code, NONOBS and NOLABEL means do not provide count and labels column in our output. To only get mean and median in our data we have written MEAN MEDIAN.
PROC MEANS DATA = SASHELP.SHOES NONOBS NOLABEL MEAN MEDIAN;
CLASS REGION;
RUN;
Saving outputs as datasets
Let me define my library mylib using following SAS code:
LIBNAME mylib "/home/u50167832/My_datasets";In the following code, we are calculating Count and average for sales column grouped by each region.
NOPRINT keyword tells SAS not to open any output window.
OUTPUT OUT = defines the location of sas dataset to be saved as an output.
N = Count and MEAN = Average denotes the new column names.
PROC MEANS data = SASHELP.SHOES NOPRINT;
CLASS REGION;
VAR SALES;
OUTPUT OUT = mylib.proc_means_output1 N = Count MEAN = Average;
RUN;
Automatically renaming the columns
Instead of manually specifying new column names we can use automatic naming convention by SAS.
In the following code chunk, we have calculated N and MEAN for all the numeric columns and we have mentioned N = MEAN = /AUTONAME for automatically renaming them
PROC MEANS data = SASHELP.SHOES NOPRINT;
CLASS REGION;
OUTPUT OUT = mylib.proc_means_output N = MEAN = /AUTONAME;
RUN;
Dropping column from output and calculating individual statistics for different variables
On saving the output we get _TYPE_ and _FREQ_ default columns. To drop them we have mentioned (DROP = _TYPE_ _FREQ_) along with our output dataset name.
In the following code, we are calculating N only for returns and inventory columns and standard deviation for returns column.
PROC MEANS data = SASHELP.SHOES NOPRINT;
CLASS REGION;
OUTPUT OUT = mylib.proc_means_output2(DROP = _TYPE_ _FREQ_) N(RETURNS) = N(INVENTORY)  = STD(RETURNS) = /AUTONAME;
RUN;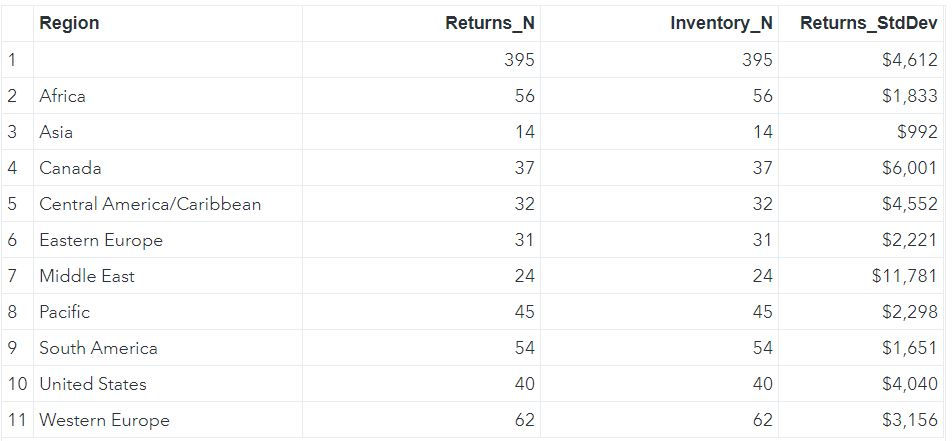
We can also save the output when multiple categorical variables are defined in CLASS statement.
PROC MEANS data = SASHELP.SHOES NOPRINT;
CLASS REGION PRODUCT;
OUTPUT OUT = mylib.proc_means_output3 N = MEAN = /AUTONAME;
RUN;
Saving multiple output SAS datasets when we have multiple categorical variables in CLASS Statement
In the following code we are saving 3 output files as follows:
Proc_means_output3 : Contains PROC MEANS output grouped only by PRODUCT
Proc_means_output4 : Contains PROC MEANS output grouped only by REGION
Proc_means_output5 : Contains PROC MEANS output grouped by both REGION and PRODUCT.
We are only calculating N and MEAN for variables Sales and inventory.
PROC MEANS data = SASHELP.SHOES NOPRINT;
CLASS REGION PRODUCT;
VAR SALES INVENTORY;
OUTPUT OUT = mylib.proc_means_output3(where = (_TYPE_ = 1)) N = MEAN = /AUTONAME;
OUTPUT OUT = mylib.proc_means_output4(where = (_TYPE_ = 2)) N = MEAN = /AUTONAME;
OUTPUT OUT = mylib.proc_means_output5(where = (_TYPE_ = 3)) N = MEAN = /AUTONAME;
RUN;
PROC SUMMARY:
PROC SUMMARY has same utility as PROC MEANS.
Refer to the following tutorial to understand the differences between PROC MEANS and PROC SUMMARY: PROC SUMMARY vs PROC MEANS
Comments