Dealing missing values in Python
- Ekta Aggarwal

- Jan 28, 2021
- 2 min read
In this article we will learn about how to filter data having missing values, remove them or count them.
A missing value can be created using Numpy's .nan function. So let us firstly import Numpy as np
import numpy as np
import pandas as pd
Dataset:
Let us create a dataset where missing values are created by np.nan
data1 = {'Product_category': ['Makeup', 'Biscuits', 'Household_Cleaning', 'Cold_drinks'],
        'Sales': [10000, 2000, 17891, np.nan],
        'Returns' : [678, np.nan, 678,234]}

data1 = pd.DataFrame(data1)
data1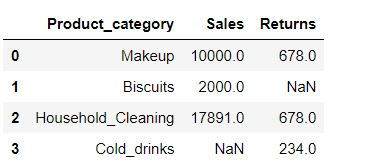
isnull ( ) function
isnull( ) function returns True when a missing value is encountered, otherwise returns False.
data1.isnull()For index 1 and 3 we have Returns and Sales value as True respectively.

Applying isnull( ) on a column
data1.Sales.isnull()In the data, in sales column we had a missing value at index =3 thus we have a True at that position.

Filtering for rows having missing values.
Task: Filter for rows where Sales values are missing.
We can filter the rows using .loc and apply our Boolean vector of True and False (which we have got the in the previous code)
data1.loc[data1.Sales.isnull(),]
notnull ( )
notnull is complementary of isnull( ) .When the data is missing then notnull( ) returns a False, while for non-missing data it returns True.
Filtering for rows having non-missing values.
Task: Filter for rows where Sales values are not missing.
We can filter the rows using .loc and apply our Boolean vector of True and False i.e. data1.Sales.notnull()
data1.loc[data1.Sales.notnull(),]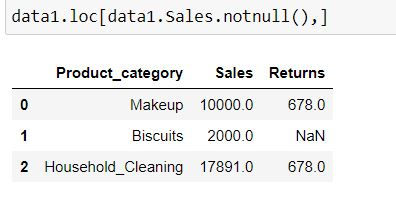
Getting total number of missing values.
Using sum( ) and isnull( ) function we can get the total number of missing values in a column
sum(data1.Sales.isnull())
data1.Sales.isnull().sum() #Alternatively
Output: 1
Getting total number of non-missing values.
Using sum( ) and notnull( ) function we can get the total number of non-missing values in a column
sum(data1.Sales.notnull())
data1.Sales.notnull().sum()
Output: 3
Filling missing values
We can fill missing value in a data using fillna( ) function.
data1.fillna(value="Missing")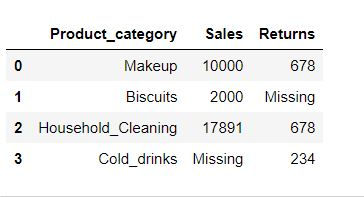
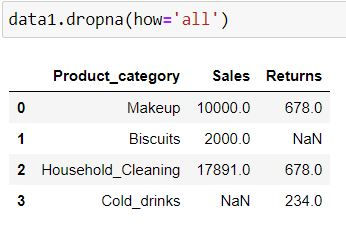
Dropping missing values
Using dropna( ) function we can drop the rows having missing values.
By specifying how = 'all' we are telling Python to delete the rows where all of the columns have missing values (that is entire row is full of NaN)
data1.dropna(how='all')Since we did not have any row where all columns have missing values thus no row got deleted.
By specifying how = 'any' we are telling Python to delete the rows where at least one missing is present.
data1.dropna(how='any')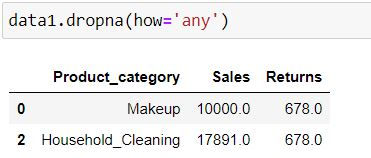
In the above 2 codes we are considering all the columns for missing values. To consider only some of the columns we define subset = ['list of columns to be considered']
For the code chunk below, those rows will be deleted where there is missing value is Sales column.
data1.dropna(subset = ['Sales'],how = 'all')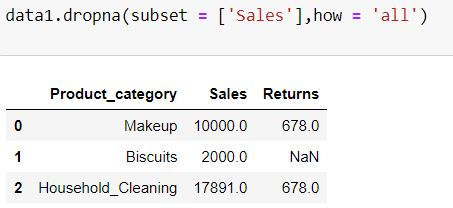
In the following code, those rows will get deleted where there is missing value in either of the 2 columns (as how = "any")
data1.dropna(subset = ['Sales','Returns'],how = 'any')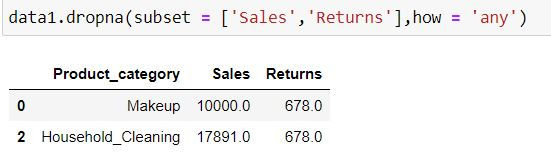
inplace = True
By default Python does not make changes in the original dataset as inplace = False. To make changes in the original data we need to specify inplace = True
data1.dropna(subset = ['Sales','Returns'],how = 'all',inplace = True)
data1


Comments